AI for portfolio management: from Markowitz to Reinforcement Learning FinTech
Jul 16, 2023|11 min read
SHARE THE ARTICLE
Artificial intelligence, machine learning, big data, and other buzzwords are disrupting decision making in almost any area of finance. On the back office, machine learning is widely applied to spot anomalies in execution logs, for risk management and fraudulent transaction detection. At the front office, AI is used for customer segmentation and support and pricing the derivatives.
But of course, the most interesting applications of AI in finance are in the buy-side and are related to searching the predictive signal in the noise and catching that alpha. They include but are not restricted to time series forecasting, the regime-switching detection, market segmentation, and, of course, asset portfolio management.
This article is fully devoted to the latter problem — we will review classical mathematical methods for optimizing portfolio, unsupervised, supervised machine learning approaches, reinforcement learning agents and some more exotic options. The material of this topic is tightly correlated with the inner expertise of Neurons Lab where I am co-founder and CTO and the course I was teaching at UCU data science summer school. As always, you can find all source code on GitHub and the results of the experiments further in this article.
Just in case you don’t know what it is 🙂
Classical optimization
The task title is already telling us that we’re working on the optimization problem: maximizing or minimizing some function with respect to its parameters. In our case, we would like to maximize returns while minimizing the risk with respect to the amount of money we allocate on each asset in our portfolio. In the layman terms:
We have $1M and we need to split it among different assets (or leave in cash) in such a way, that at the end of some time period this $1M grows as much as it can with minimal risk of losing the money.
Markowitz efficient frontier
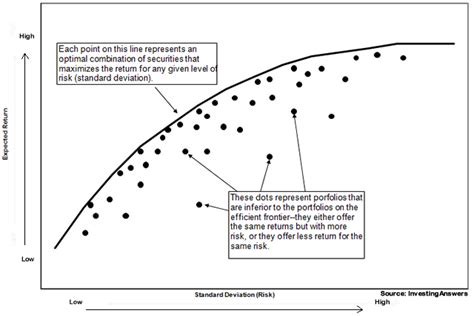
If we assume, that all investors on the market are rational, avoid risks whenever possible and aim to maximize their expected returns we can plot all possible portfolios on the 2D plot with risk and expected returns as axis:
The optimal decision can be found with maximizing expected returns (calculated from the previous movements of the asset) and minimizing associated risk (as volatility of the assets). The ratio of expected return divided by risk is called Sharpe ratio and the portfolio with the maximal Sharpe ratio can be found with a rather standard optimization toolkit.
Custom objectives
Of course, there are a lot of different optimization criteria we might aim for. What if we even don’t care about the expected returns and just want to minimize the risk?
Minimal variance portfolio optimization function
Or maybe we want to diversify our portfolio as most as we can?
The maximum diversification portfolio optimization function
Or probably invest only in decorrelated assets? Or maybe assure the equality of the risks in each of the assets?
Equal risk contribution portfolio optimization function
Check more examples of optimization criteria here, the most important part about it is that you can design them yourself taking care of your own business objectives.
Unsupervised learning
Also, the portfolio optimization problem looks a lot like unsupervised learning task or representation learning task: having a set of assets we need to group them into some “clusters” based on their profitability and after allocate more funds on the most predictive ones and less on the opposite side. What algorithms could we use for this purpose?
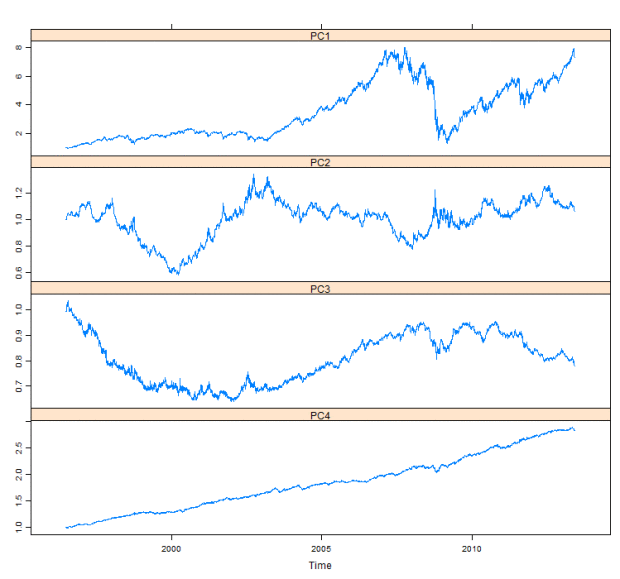
One of the first unsupervised learning models you get familiar with at the machine learning class is a principal component analysis (PCA). It decomposes multidimensional data into the set of linearly uncorrelated variables, where the first such variable (also called principal component) is explaining the most variation in the data, and all next variables are sorted by having the maximal variance while being orthogonal to the previous variable. How we can use it for portfolio management? Many ideas are published, the most common one says that the first principal component serves as an approximation of the market, hence, choosing second and other components will give uncorrelated to the market strategies, which is what most of the investors want.
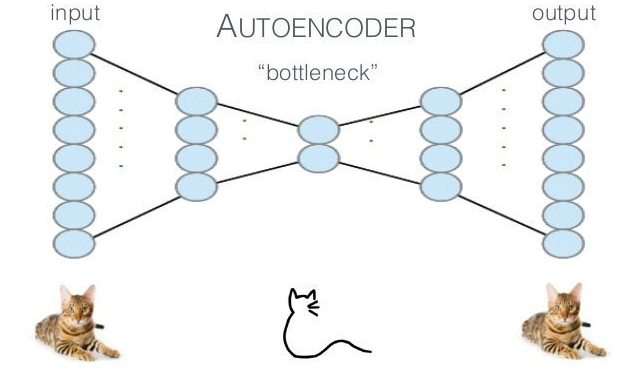
PCA is a great tool, but it relies only on the linear dependence between the data axis. One of the alternatives, that allows non-linear dimensionality reduction, is based on neural networks — autoencoders. They can “squeeze” input data into some low-dimensional vector and after restore input from this representation. The idea of autoencoder can be exploited in many ways for portfolio selection, one of them is related to the evaluation of the risk carried by the particular asset: if some asset movement can’t be restored well (the predicted value differs a lot from the input in terms of, let’s say, mean squared error) from the low-dimensional representation — it’s associated with higher risk (and, possibly, higher profits). Please, see an example of this kind of portfolio in the experiments section.
Hierarchical risk parity
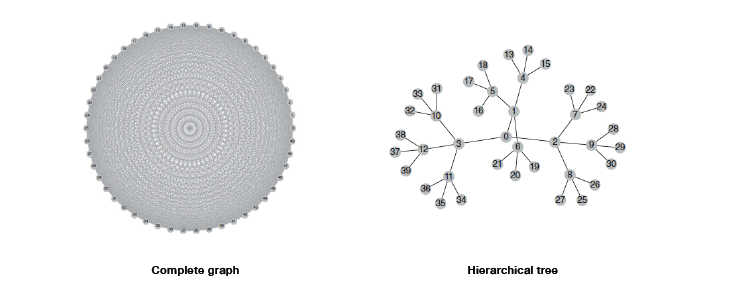
Geometrically, a covariance matrix of the assets in the portfolio is a complete graph (on the left), can we figure out a tree-based model that will be more optimal?
One of the optimization-based portfolio management methods is a risk parity model. It is also stated as an optimization problem, where we allocate rather the risk than the capital resources. The problem of this approach (and, actually, most of the approaches described in this article) matures when we’re working with portfolios of very huge size — if we represent connections between assets geometrically, they will be in the form of the complete graph (see image above), which is an over-complication in the world of hierarchies. The solution lies again in unsupervised learning, but with the exploitation of the hierarchical clustering algorithms applied to the covariance matrix. After finding clusters of the assets, we can re-allocate risk over them recursively. The high-level procedure described below:
A high-level description of the hierarchical risk parity (HRP) portfolio optimization algorithm
Supervised learning
The optimization and representation approaches look cool and legit, but they have one major drawback: they just exploit informationabout the past asset movements and co-correlations without any assumptions about their future behavior. Do we agree that in the future assets will move the same as in the past? Not really! That’s why we need some ways to exploit predictions about the future as the allocation weights.
The idea is rather very straightforward: if we can use any model to predict the price movement in the future, we can use this prediction as to the allocation weight. Of course, we need to normalize these predictions so their sum is equal to one, but this is rather a technical step and can be done or with the softmax with tuned temperature, or even with the single L1-normalization. Nice point here is, that we also can take into account associated risk of prediction if we work with Bayesian machine learning or models like ARIMA. In this article, we will use the simplest forecasting algorithm: exponential smoothing, but you can easily extend it to, for example, deep learning with the use of other tutorials from my blog.
Reinforcement learning
How about diving deeper and treating asset allocation not just as a one-step optimization problem, but as continuous control of the portfolio with the delayed reward? Let’s move from optimal allocation to optimal control territory and in a data-driven world, it can be solved via various reinforcement learning algorithms. They don’t do predictions and don’t learn the structure of the market implicitly. They do more: directly learn the policy of changing the weights dynamically in the continuously changing market!
The idea of Q-learning applied to portfolio management is the following: we can describe the market with some state s_t and with doing some action on this market and going to the state s_{t+1} we get a reward (changed value of our portfolio based on the weights we applied). The name “Q-learning” comes from the Q(s, a) function, that based on the market state s and provided action a (in our case, it’s allocation weights) returns the expected reward. Today this function can be approximated with deep neural networks and we can train such a model to optimize for a Sharpe ratio or any other criteria, but not just for a single allocation, but for a sequence of portfolio allocations, where we will exploit trained Q function for choosing the optimal actions. If you will check the source code for details, please notice, that for continuous action space with Deep Reinforcement Learning we need to use some tricks.
Evaluation in the wild
The above review is nothing without some quantitative evaluation on the real data. I suggest two following benchmarks:
In both cases, we will use equal allocation as a benchmark and compare all the models we discussed previously quantitatively. The animations below show both equity curves and allocations weights (click on image to zoom and see allocations better). Also, please, check out the code on GitHub.
Note: these experiments are shown for the visualization and presentation purposes only. In real life, asset management algorithms have to re-weight allocations and be re-trained over time more carefully including hyperparameter search. Also, they need to be tested and evaluated in a much more rigorous manner. Last but not least, strong risk management system has to be built over any of your trading strategies, nevertheless they perform in backtesting or paper trading mode.
ETF dataset
In this experiment, we are using 180 trading days for making the decision (estimating covariance matrix, forecasting time series, fitting autoencoder or RL agent, etc) and for the next 180 days, we are holding the assets with respect to the weights found by the algorithm. After this holding period, the re-weighting procedure starts again.
Minimal Variance, Maximal Returns and Maximal Sharpe portfolios (click on image to zoom)
Maximal Decorrelation, PCA and HRP portfolios (click on image to zoom)
Smoothing forecasting, Autoencoder, and RL agent portfolios (click on image to zoom)
Cryptocurrencies dataset
In the case of the cryptocurrency portfolio, we have selected 180 days for the decision-making period and reduced holding time to three months due to the understanding that the market is very volatile.
Minimal Variance, Maximal Returns and Maximal Sharpe portfolios (click on image to zoom)
Maximal Decorrelation, PCA and HRP portfolios (click on image to zoom)
Smoothing forecasting, Autoencoder, and RL agent portfolios (click on image to zoom)
Results discussion
Summarized performance metrics you can find in the tables below.
Statistics of the portfolios on the ETFs dataset
Statistics of the portfolios on the cryptocurrencies dataset
We can conclude, that indeed machine learning models can beat the market benchmark in terms of Sharpe ratio and in some cases perform better than classical optimization models. The best performance is shown in both cases by PCA portfolios, or RL agent portfolios because of their ability to learn the market structure, with more good options on the cryptocurrency market, which can be explained by its immaturity and relative predictability. I want to underline again, that all the models mentioned before have to be tuned and tested more carefully before being used in production.
A not on HRP
As we can see, hierarchical risk parity in both benchmarks is allocating almost 100% of the capital on a single asset. Since I’ve used the code of the author and didn’t spot any mistake there, I’ve decided to make a lask check of its performance on some “random” portfolio that includes popular assets from AAPL and GOOGL to MCD, SBUX, and BTC. In this case, it performs adequately and, if tuned carefully, outperforms the equal allocation benchmark. See more details on the source code.
HRP performance on the more diversified portfolio. As we can see, in this case, it allocates weights over all the assets
A note on Reinforcement Learning
In this article, RL is implemented only as a proof-of-concept of multidimensional continuos-reward control, purely trained and evaluated on the in-sample data. Also, it tends to learn exploitation instead of exploitation more, which is another sign of ill setup. Last but not least, the input for the Q function approximation was the covariance matrix which might be not the best option. For the production use, more careful work is needed but this example can serve as a starting point.
Other approaches
Of course, asset management algorithms are not restricted to the above-mentioned ones. If we’re talking about optimization-based portfolios, it’s worth to take a look on: evolutionary algorithms that can replace classical optimization algorithms for complex target functions and huge portfolios, multicriteria optimization that will allow you to find the balance between a lot of different optimization targets, Litterman Portfolio and, of course, celebrated CAPM.
If you liked the idea behind unsupervised learning, I suggest taking a look at generative adversarial networks and variational autoencoders as the models that are showing the best results in generative modeling and factor learning today. They can help with learning market structure and hidden driving factors even more precisely.
Last but not least, optimal control direction looks like the most promising one: apart of reinforcement learning and related approaches, it’s worth to take a look at more mathematically grounded models like Stochastic Portfolio Theory.
Conclusions
What to do next? That’s a good question. It mainly depends on your portfolio, your markets and at which point of the development you’re at the moment. If you’re just starting with wealth management and use some “classical” approaches, I really suggest you playing with unsupervised learning methods as HRP and PCA. They contain less risk than forecasting based methods or reinforcement learning and allows you a better interpretation of the results. If you’re an experienced quantitative asset manager, I believe that optimal control and reinforcement learning is the next frontier to explore and exploit. Also, see Lopez de Prado’s book on correct cross-validation of ML models and backtesting of the algorithms.
In any case, whether you’re just starting working on quantitative investments or you already have a lot of complex developments, don’t hesitate to contact us at Neurons Lab. We’re an innovative and creative European AI boutique specialized on fintech applications and we’re ready to help in various issues.
P.S.
If you found this content useful and perspective, you can support me on Bitclout. You also can connect with me on the Facebook blog, where I regularly post short AI articles or news that are too short for Medium, Instagram for personal stuff and Linkedin!